
Contents
Zone Reports
Regardless of store size, all stores operate as separate business units. Within each store, sub-business units exist that are referred to as zones. Each zone is assigned a zone manager. Some zone managers may handle multiple zones depending on their capabilities and experience.
Typical Centerplate stores vary in size between 2,500 and 4,500 square feet, with our flagship large format store in excess of 42,000 square feet.
Smaller stores and may not carry a complete array of merchandise due to space limitations.
All stores however are divided up into the following the zones:
- Impulse purchase and main promotional area
- The best sellers and discounted items
- Fiction section and related literary titles
- Business and a reference section
- Sports
- Nature and hobbies
- Multimedia
- Children’s books
The flagship store has a unique merchandise plan and does not apply to the typical stores in our Centerplate chain.
Through historical data, each zone is given sales budgets that are reviewed on a weekly basis at supervisor meetings with the store general manager. Prior to this meeting, zone supervisors may generate a zone sales report. Various zone reports are available enabling a zone manager to “drill down” from overall zone productivity to category performance to specific Stock Keeping Unit (SKU) based data.
Note that when a store is designed, zones are allocated including the actual square footage of the zone. The zone report at the higher zone level can therefore express sales per square foot for the week, and also estimate the sales per square foot on a Season to Date basis.
Floor plans are adjusted between the Fall and Spring seasons and zones sizes are also adjusted accordingly by the finance department.
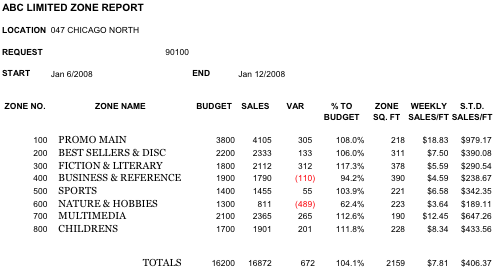
As mentioned, zone reports can be specified by start and end dates, store, zone, category and Stock Keeping Unit (SKU) level. Below is a sample of a manager’s zone report that reflects the overall performance of the store. Special orders are merged with the zone that the special order applies to. When a manager reviews sales per square foot performance of a zone, historical data determines acceptable levels for zones and varies from zone to zone. Not surprisingly, the main promotion and sales area at the front of the store generates the highest sales per square foot performance.
Periodically, discussions between the general store manager and regional director on space allocated to specific zones may result in the request in size adjustments within the floor plan. Better performing zones may be expanded while poor performing zones may be contracted. The zone supervisor is encouraged to participate in discussions regarding zone size based on performance per square foot.
Below is a sample of the store level zone report for the week of January 6th to January 12th, 2010 for a sample store.
Restock Analysis
The zone supervisor is responsible for maintaining optimal stock levels within their areas of responsibility. Merchandise levels must serve our customers and be balanced between excess stock creating high overhead and minimizing the risk of out of stock positions for items in demand.
Management of zone merchandise levels must meet the Core Product management Policy outlined in section I.3 as well as acceptable inventory turn rates as stipulated in our Inventory Turns Management Policy outlined in section I.4.
Zone supervisors must generate Stock Keeping Unit (SKU) reports by Category and make decisions on re-stock quantities. Although this is the formal responsibility of the zone supervisor, customer service associates can be delegated specific categories to review, and make recommendations in regards to replenishment.
Restock reports generated by category can include or omit the retail value of the Stock Keeping Unit (SKU) item. With this extra information, a zone supervisor may consider allowing an out of stock position on a Stock Keeping Unit (SKU) that has sold poorly and has a high end price. These types of items can become special orders and free up funding to stock the zone. High priced, high demand items such as multimedia should of course, should be stocked in an aggressive manner.
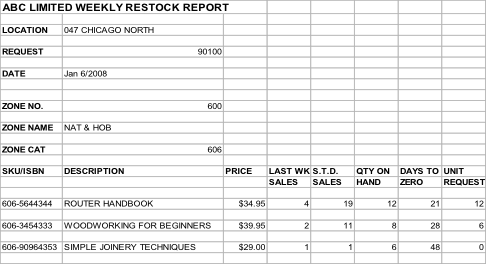
Below is a sample section of a zone report that can guide a zone supervisor on replenishment. Note the column where quantities are keyed in by the zone supervisor. When complete press the <F9> key.
The system will prompt the zone supervisor to finalize the restock request:
Finalize Restock request? <F10> to complete <Esc> to return
When the restock request is finalized, the request is transmitted to the support office in the overnight poll for processing.
Common restocking errors:
- Allowing a high demand item to reach an out of stock position.
- Overstocking items that are dropping in customer interest.
- Failing to recognize rapid increases in specific product interest. This is typical after a product receives positive media coverage or when new software versions are to be released.
- Failure to track SKUs on a weekly basis. Order conservatively every week and review performance. Do not over order stock and then stop reviewing weekly performance.
Core Product Management Policy
Core products are those items that are deemed necessary to stock at all times. All employees should familiarize themselves with the core products that typically compose approximately 10% of the store’s stock array.
- When conducting stock replenishment reports make sure that core items within your area of responsibility are always in a strong in-stock position.
- All core items are stocked in our warehouse and when requested are shipped within one week.
- Items deemed as core items are determined by Support Office Merchandise Allocation Coordinators. Core item lists are updated monthly and sent to the general store manager for review and distribution. In rare cases where there is an urgent need to upgrade an item to a core item, the Support Office will send and email to all stores.
Inventory Turns Management Policy
Inventory turnover is another metric we use to determine store productivity. Clearly, slow turnover creates higher overhead and diminished profit. Merchandise turnover is calculated as:
Dollars Sold/Dollars in stock x % = 6.0
Inventory turns may be calculated as a current “snapshot” of the zone or store. At season end and year end, the figure is determined to understand the long term performance of the zone or store.
Inventory turns vary from high rates for sale and promotion zones and multimedia as high as 14 times per year.
Mainstream items turn slower as low as 4 times per year.
Currently, our target turnover at store level is 6.0 times per year, and is part of a general store manager’s responsibility to manage.
Merchandising Policy
Merchandising is a complex art and is best left to the specialists at the Support Office.
Merchandising specialists develop plans for the stores on a seasonal basis and update our Merchandising manual semi-annually.
Refer to this manual for merchandising guidelines. Updates are sent out weekly and should be placed at the rear of this binder so all staff know where to refer to the most recent updates. When necessary, merchandise updates will include photos, sketches or diagrams to help clarify changes to the store merchandise plan.
Top Seller Reports
Another useful report in tandem with review of core items is the top seller report available in the Bookmaster system.
The top seller report generates lists of items that are selling well in your store. Unlike the core list that is a chain wide document. Your Top seller report is a reflection of your specific store’s best selling items.
Like the core products list, zone supervisors and managers should watch these items carefully and ensure that your store never encounters an out of stock position.
Conversely, be wary of items that begin to experience a rapid loss of sales. This usually happens when top sellers are part of some interest trend that wanes or subsides with our customers.